
Tracking & attribution layer
An attribution and tracking layer that sits on top of your existing CRM, KYC provider, cashier and trading platform. It consolidates the event stream, keeps each trader connected to the source that acquired them through signup, KYC, FTD, first trade and LTV, and returns the outcomes that matter to Meta and Google.
Illustrative record. The customer record grows in value, then that value flows back to the sources that created it.
The problem
Google and Meta know about the click and the signup. Your CRM, KYC provider, cashier and trading platform know what happened afterwards. Nobody joins the two halves, so the broker optimises around what is easiest to count.
Registrations and FTDs get credited to the last touch. Channels that create volume get scaled; channels that create valuable traders get cut.
Marketing, CRM, KYC, payments and the trading server each hold a piece. Reconciling them is a monthly spreadsheet, and the numbers never quite agree.
Meta and Google optimise on the events they receive. If the valuable events, KYC passed, first deposit, trading activity, live elsewhere, the algorithm buys more of the wrong people.
Referral overwrites, lost links and unknown-source signups turn partner payouts into arguments. Volume hides KYC rejects, chargebacks and weak trader value.
How the layer works
Four jobs, in order. The first two are plumbing most brokerages have never owned. The last two are where the commercial decisions come from.
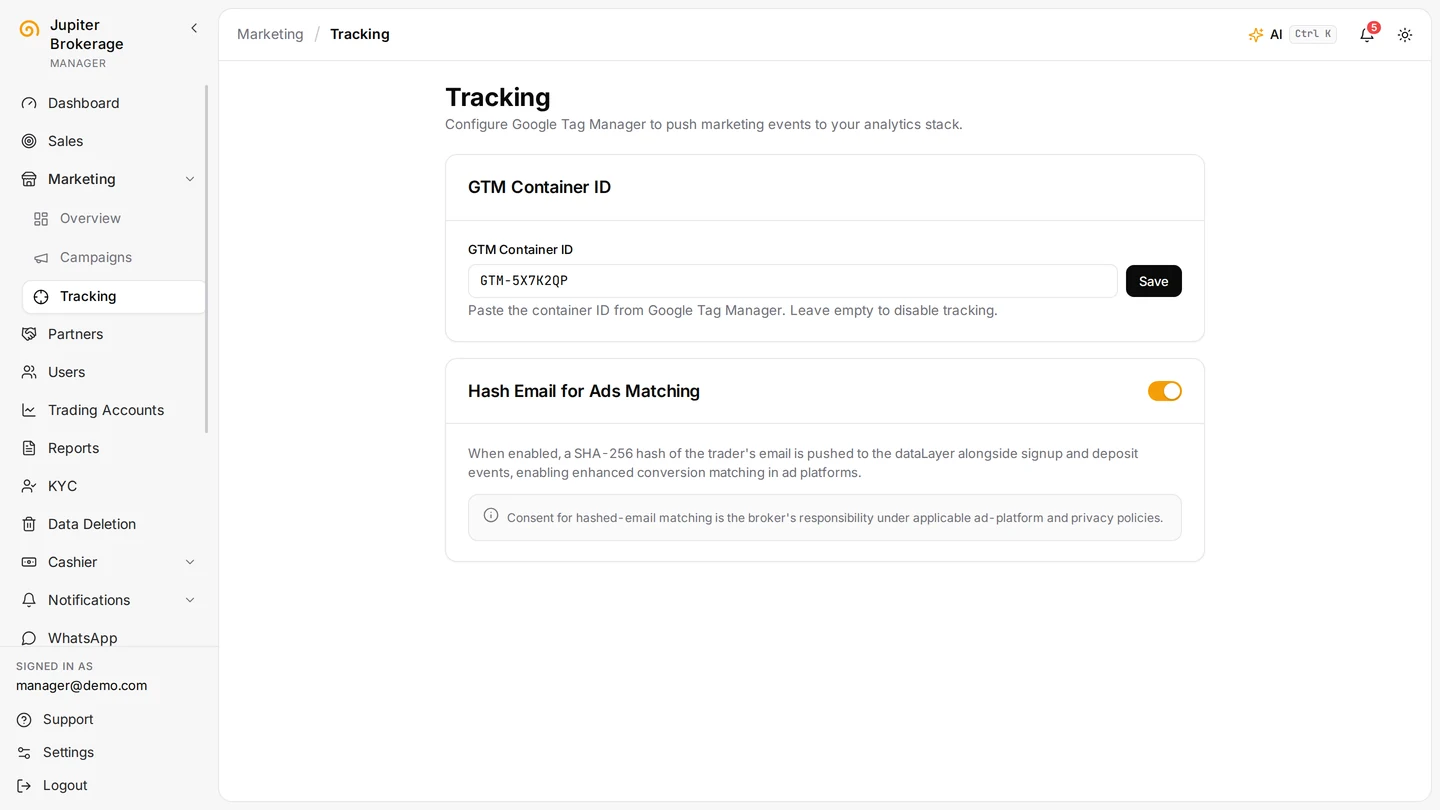
Click IDs, source, campaign and geo are captured when the visitor lands and carried into the signup. A Google Tag Manager container and hashed-email matching are configured once for the marketing site.
A pre-KYC lead ID becomes a post-KYC client ID without losing the acquisition context. Signup, KYC started, KYC approved, deposit attempted, FTD, first login and first trade are recorded as events with timestamps and stable IDs.
Deposits, volume and trading activity from the trading platform roll back up to campaign, channel, geo, publisher and IB. Cost per signup, per KYC, per FTD and per first trade, time to FTD, and value by cohort.
Configured downstream signals, such as KYC passed, FTD and trading activity, are returned to Meta and Google so their optimisation runs on traders who fund rather than clicks that register.
Better measurement and better optimisation inputs. Not autonomous ad budgets, and not a guaranteed ROAS uplift.
Cohort economics
Deposit and FTD are milestones, not the measure of a customer. Once value is attributed, the same cohort can be compared by geo, channel, publisher or IB to show where the valuable traders actually came from, and which sources only create noise.
Paid media performance
Campaign A produces many signups and weak downstream value. Campaign B produces fewer signups and more funded, valuable traders. The layer reveals the difference, and can return the eligible funded or value signal to the platform that bought the click.
IB attribution
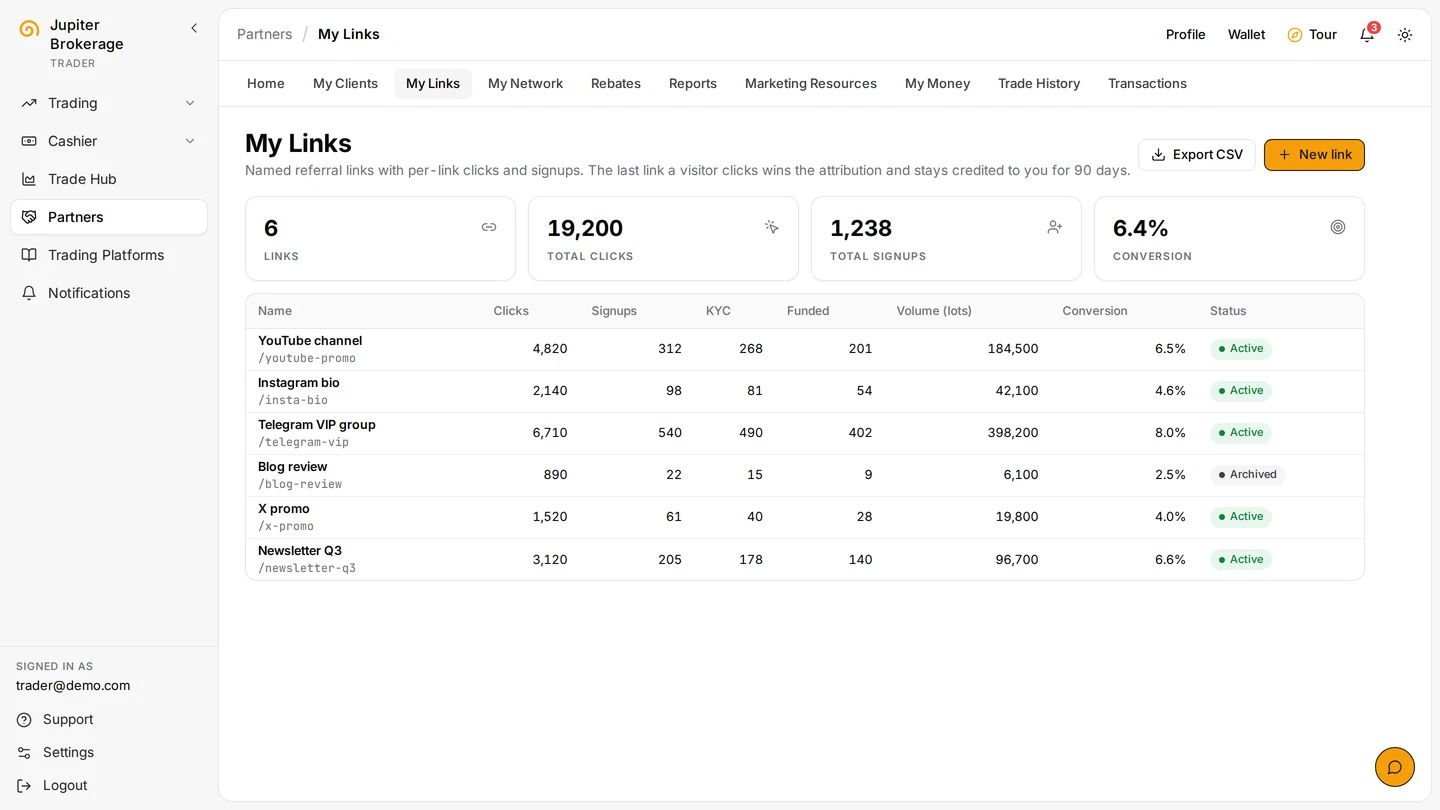
Every IB gets a link per campaign, so the partner and the broker both see clicks, signups, KYC, funded accounts and volume for each one. Attribution integrity is monitored so referrals are not overwritten, and payouts stop being disputes.
Start with the audit
A free funnel and attribution audit, run the way we have run it across more than thirty brokerages: as a prospect, through your own signup, KYC, deposit and first trade, then against your event data. You get a leakage map, the size of the prize, and a 90-day plan your team can run.
What we check
What you receive
Leakage map
Every stage from click to net revenue contribution, with the value-weighted loss at each one.
The size of the prize
The one constraint worth fixing first, quantified against your own volume and CPA.
A 90-day plan
One owner, one scoreboard, and the order to deploy in so nothing gets built twice.
Monday morning: five non-negotiables
Answer honestly. “With numbers” means a figure you could read out in a leadership meeting this week, not an estimate.
Free funnel & attribution audit
We need a week, a walkthrough of your stack, and read access to the event data you already have. You get the findings in a working session with the people who will act on them.
Works with what you run
The layer connects to the systems you already use through webhooks, callbacks, platform sync and ad-platform imports. Week one is a discovery sprint, not a build sprint: manager API access on MT4/MT5 white labels and WhatsApp Business approval are the two things that most often block a timeline, so we check them first.
Your CRM, PSP and KYC provider already emit the events. We capture them into one stream with stable IDs and attribution fields, and the reporting layer runs on top. Weeks, not quarters.
An owned event stream with attribution integrity monitoring, IB attribution checks and nightly reconciliation. The foundation for lead routing, activation playbooks and churn engineering later.





 Your CRM
Already on Callisto?
All of this is native. The marketing dashboard, attributed users, tracking settings and IB links are the same record the sales desk and the cashier run on.
The scoreboard
These are not vanity metrics. Each one maps to a leakage point between the click and net revenue contribution.
| Pillar | Metrics leadership must own |
|---|---|
| Truth | Attribution coverage: share of leads with persisted source and campaign, and identity mapping integrity. Event stream health: missing-event rate and ingestion latency. |
| Economics | CPA funded by campaign, geo and entity. True cohort ROAS to date, and mature-gated at 7, 30, 90 and 180 days. Payback ratios. |
| Execution | Contact success rate and lead-to-call time. A weekly leakage map: top leakage stage by source and by rep. |
| FTD and retention | Deposit failure rate by reason and recovered deposit rate. Time to first login and first trade. 7-day and 30-day post-FTD active rate. |